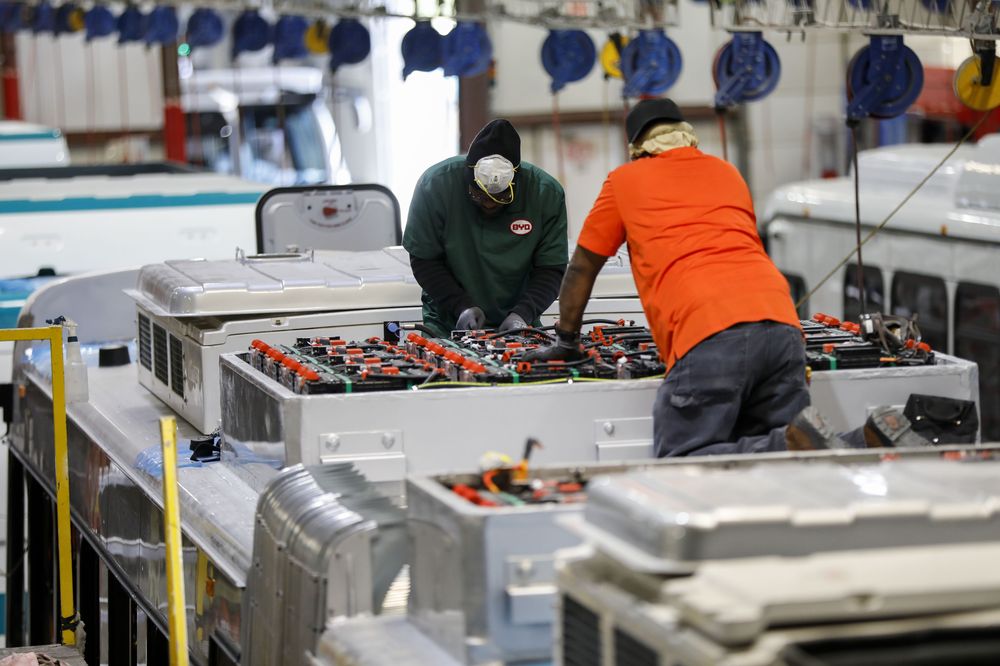
Pictured: Employees work on the roof of an electric bus at the BYD Coach and Bus factory in Lancaster, California. Photographer: Patrick T. Fallon/Bloomberg
The battery boom is coming to China, California and basically everywhere else-and it will be even bigger than previously thought.
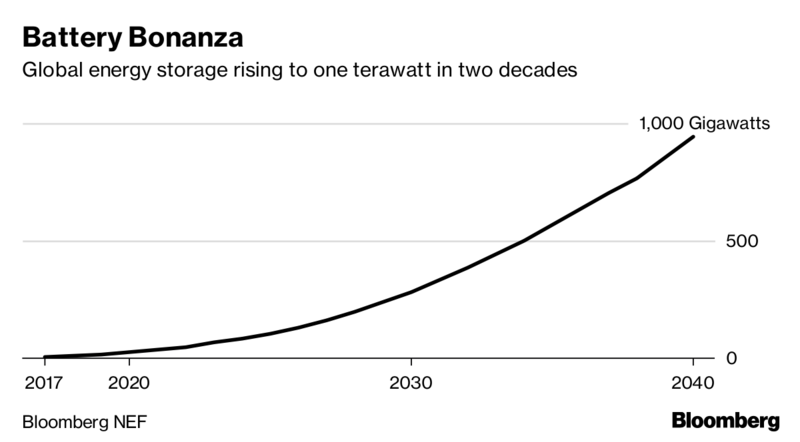
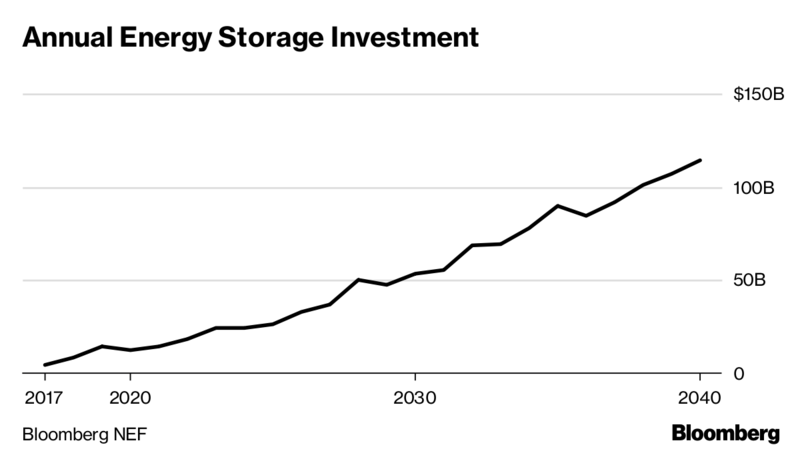
The global energy-storage market will surge to a cumulative 942 gigawatts by 2040, according to a new forecast from Bloomberg NEF published Tuesday, and that growth will necessitate $1.2 trillion in investment. Sharply falling battery costs is a key driver of the boom. BNEF sees the capital cost of a utility-scale lithium-ion storage system falling another 52 percent by 2030.
But cost isn’t the only factor. Governments from China to California are spurring demand, as is the rise of electric vehicles and solar power. There’s also been a greater focus on storage for electric-vehicle charging as well as energy access in remote areas.
“Costs have come down faster than we expected,” Yayoi Sekine, a New York-based analyst at BNEF, said in an interview. “Batteries are going to permeate our lives.”
The implications of cheaper batteries are far-reaching, upending multiple industries and helping spur technologies necessary to help fight climate change. Batteries power the electric vehicles that are popping up on our freeways. They also unlock solar power from the exclusive confines of the sun.
Two important markets come into particular focus. China, which is building up its battery-manufacturing capacity, will be a central player in the boom. California, meanwhile, has pushed through a series of measures in recent years that will directly or indirectly spur more batteries, including legislation that would require all of the state’s electricity to come from carbon-free sources by 2045.
“Storage is just so sensibly the next step in the evolution of renewable energy,” Edward Fenster, the executive chairman of San Francisco-based rooftop-solar company Sunrun Inc., said in an interview. “If we’re going to get to 100 percent renewable energy, we’ll need storage.”
Here are six key takeaways from the latest BNEF battery forecast:
These costs are based on the SA Power network in Adelaide but prices may vary depending on your circumstances. This comparison assumes a general energy usage of 4000kWh/year for a residential customer on Energy Locals Time of Use Tariff – (TOU – Peak, Off-Peak & Solar Sponge).
The reference price is set by the Australian Energy Regulator (AER) for a financial year in relation to electricity supply to residential customers in the distribution region and is based on an assumed annual usage amount. Any difference between the reference price and the unconditional price of a plan is expressed as a percentage more or less than the reference price. The terms of any conditional discounts are shown, along with any further difference between the reference price and the discount applied if a condition is met, expressed as a percentage more or less than the reference price.